Set up the Grafana dashboard
The omni_pca integration ships a Grafana dashboard bundle under
grafana/
in the integration repo. It’s a self-contained docker-compose stack
(InfluxDB v2 + Grafana) pre-provisioned with the Omni Pro II — Panel
Overview dashboard — security state, climate trends, push-event
activity, system health, all in one view.
What you need
Section titled “What you need”- A working
omni_pcainstall — see Install in Home Assistant if you haven’t done that yet. - Docker + docker compose.
- ~30 minutes of panel runtime so there’s interesting data to graph.
1. Boot the stack
Section titled “1. Boot the stack”Clone (or pull) the integration repo and bring up the bundle:
git clone https://git.supported.systems/warehack.ing/omni-pca.gitcd omni-pca/grafana/cp .env.example .envEdit .env. Three secrets matter:
INFLUX_PASSWORD=<a strong password>INFLUX_TOKEN=<32 hex chars, generated with: openssl rand -hex 32>GRAFANA_PASSWORD=<a different strong password>Then:
docker compose up -dFirst boot takes ~30 seconds — InfluxDB provisions the omni-pca org,
the ha bucket, and the admin token; Grafana then auto-wires the
datasource and loads the dashboard.
2. Tell Home Assistant to ship state
Section titled “2. Tell Home Assistant to ship state”Paste the contents of grafana/ha-snippet.yaml into your HA
configuration.yaml. The default settings assume HA and InfluxDB
live on the same machine and reach each other by container name; if
your setup is different, change the host: value (see the snippet’s
inline comments).
Add the token to secrets.yaml:
influxdb_token: <same INFLUX_TOKEN from .env>Restart HA. Within ~30 seconds, state changes from omni_pca entities start landing in InfluxDB.
3. Open the dashboard
Section titled “3. Open the dashboard”Browse to http://localhost:3000. Log in as admin with your
GRAFANA_PASSWORD. The dashboard is on the home page (it’s the only
one provisioned). If you don’t see live data yet, give it a minute —
HA’s InfluxDB shipper batches writes.
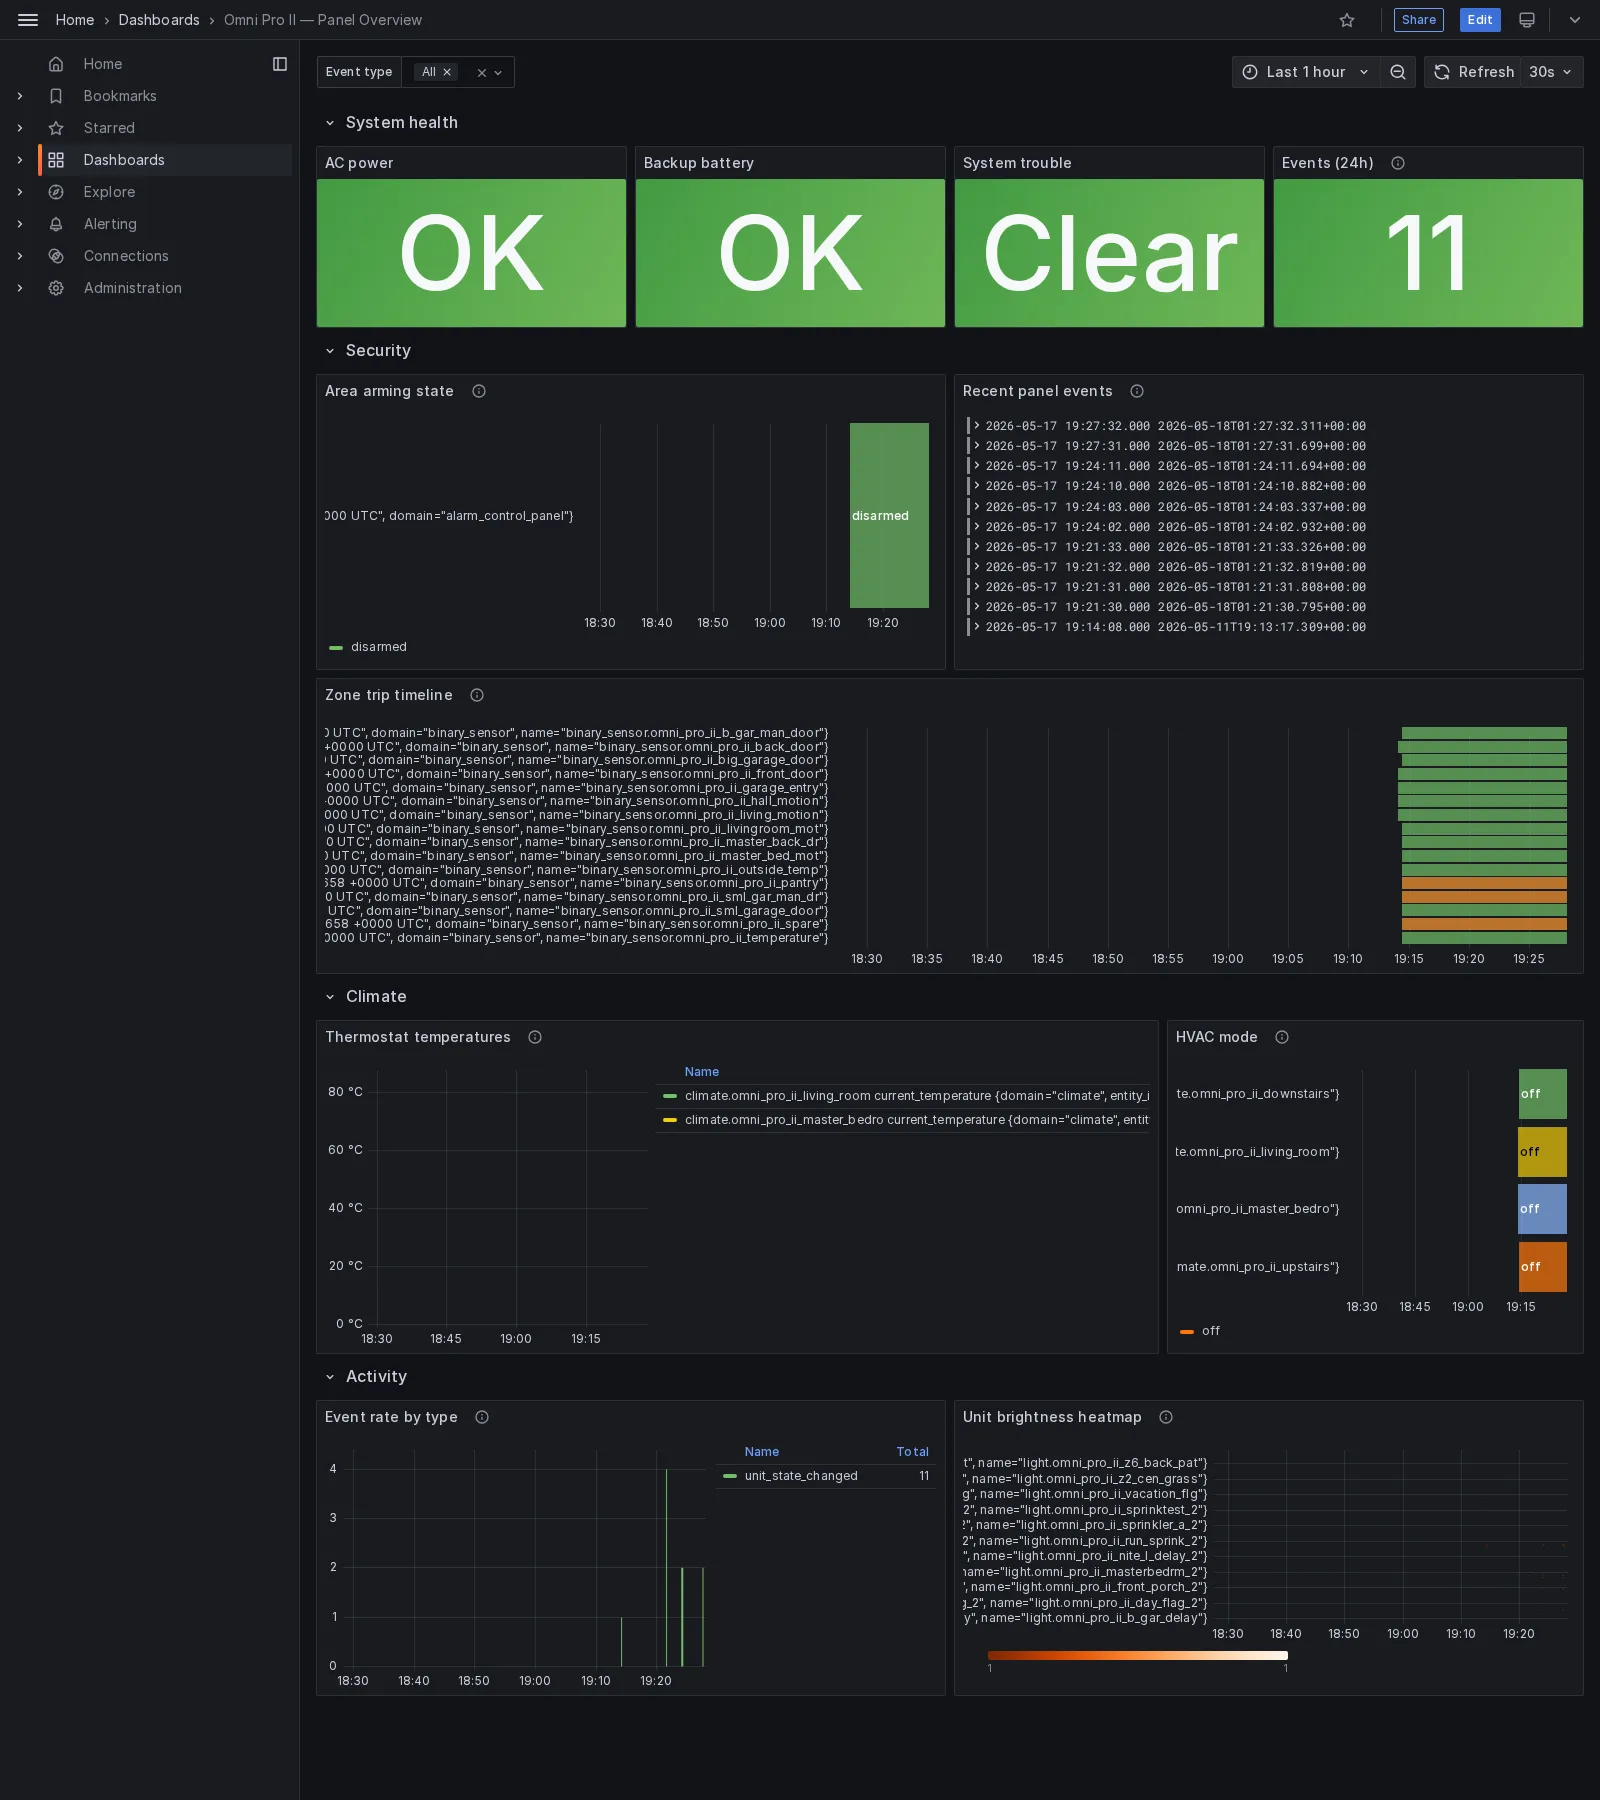
The dashboard’s four rows cover:
- System health — AC power, backup battery, system trouble, 24-hour event count. All four are single-stat panels; green = OK, red = problem.
- Security — area arming state timeline, recent panel events log, zone trip timeline (every binary zone painted when open).
- Climate — per-thermostat current temperatures + setpoints, HVAC mode timeline per thermostat.
- Activity — event rate by typed event class, unit brightness heatmap (Y axis = unit, X axis = time, color = brightness %).
Adapting the dashboard
Section titled “Adapting the dashboard”The provisioned dashboard is read-only in the Grafana UI by design —
the source of truth is the JSON file in
grafana/provisioning/dashboards/omni-pro-ii.json. To edit:
- Make changes in the Grafana UI (everything works, you just can’t click Save).
- Dashboard settings → JSON Model → Save to file.
- Overwrite
omni-pro-ii.jsonwith the exported version, commit if you want to keep your changes across redeploys. docker compose restart grafanato reload.
What’s in the data
Section titled “What’s in the data”HA’s influxdb: integration ships state changes for the seven
omni_pca platforms (alarm_control_panel, binary_sensor, climate,
event, light, sensor, switch). The bundle’s snippet tags
events with event_type and event_class, so Flux queries can filter
by typed event kind without parsing strings.
| Tag | Source | Examples |
|---|---|---|
domain | HA entity domain | alarm_control_panel, binary_sensor, event |
entity_id | HA entity ID minus the domain prefix | omni_pro_ii_main, omni_pro_ii_front_door |
event_type | event entity’s typed kind | unit_state_changed, alarm_activated, ac_lost |
event_class | event entity’s wire class name | UnitStateChanged, AlarmActivated, AcLost |
Fields vary by entity type — numeric metrics (temperature, brightness,
loop_reading) write to _field == "value"; string states (alarm mode,
HVAC mode) write to _field == "state". Climate entities additionally
emit current_temperature, target_temp_high/_low, humidity.
See the HA entity catalogue for the full entity surface, and the bundle’s own README for advanced configuration (custom networking, dashboard extension patterns, troubleshooting).